Introduction
I was reading a paper a few weeks ago by some folks at the University of Bath. They were computing the Ground Reaction Forces which were necessary to generate the observed motion of the Body Center of Mass (BCOM) using forward dynamics techniques. The study was well done, rigorous, and consistent with data we have collected with markerless mocap. What I found interesting was the prospect of another variation in our JumpPro product line. Currently The MotionMonitor JumpPro (force plates only) or The MotionMonitor JumpPro with Kinematics (force plates and cameras), now maybe The MotionMonitor JumpPro with Kinematics and no force plates? To check out the idea, Ian and I spent a few hours in the training center collecting some golf and counter movement jumps (CMJ) using The MotionMonitor xGen.
Comparative Force Curves
We were interested in how well the distal forces at the feet computed from segment accelerations in a top-down model would match the ground reaction forces (GRF) recorded by the force plates. The video below is the screen capture of Ian’s CMJ. The congruence of force plate GRFs in the upper graph with the computed GRF is remarkable. The computed forces expressed relative to force plate forces are as follows:
| This Trial | Average 6 Trials 2 Subjects | |
| Max take-off force | 97.7% | 102.1% |
| Max landing force | 93.3% | 97.4% |
| RFoot take-off force | 109.9% | 107.1% |
| LFoot take-off force | 84.0% | 96.1% |
| RFoot landing force | 97.8% | 99.0% |
| LFoot landing force | 87.0% | 94.8% |
| Timing Diff max take-off | – .08 sec | – .07 sec |
| Timing Diff max landing | + .03 sec | + .01 sec |
As you scroll through the video, note that peak forces, timing and symmetry of the computed forces are all consistent with data collected from the force plates.
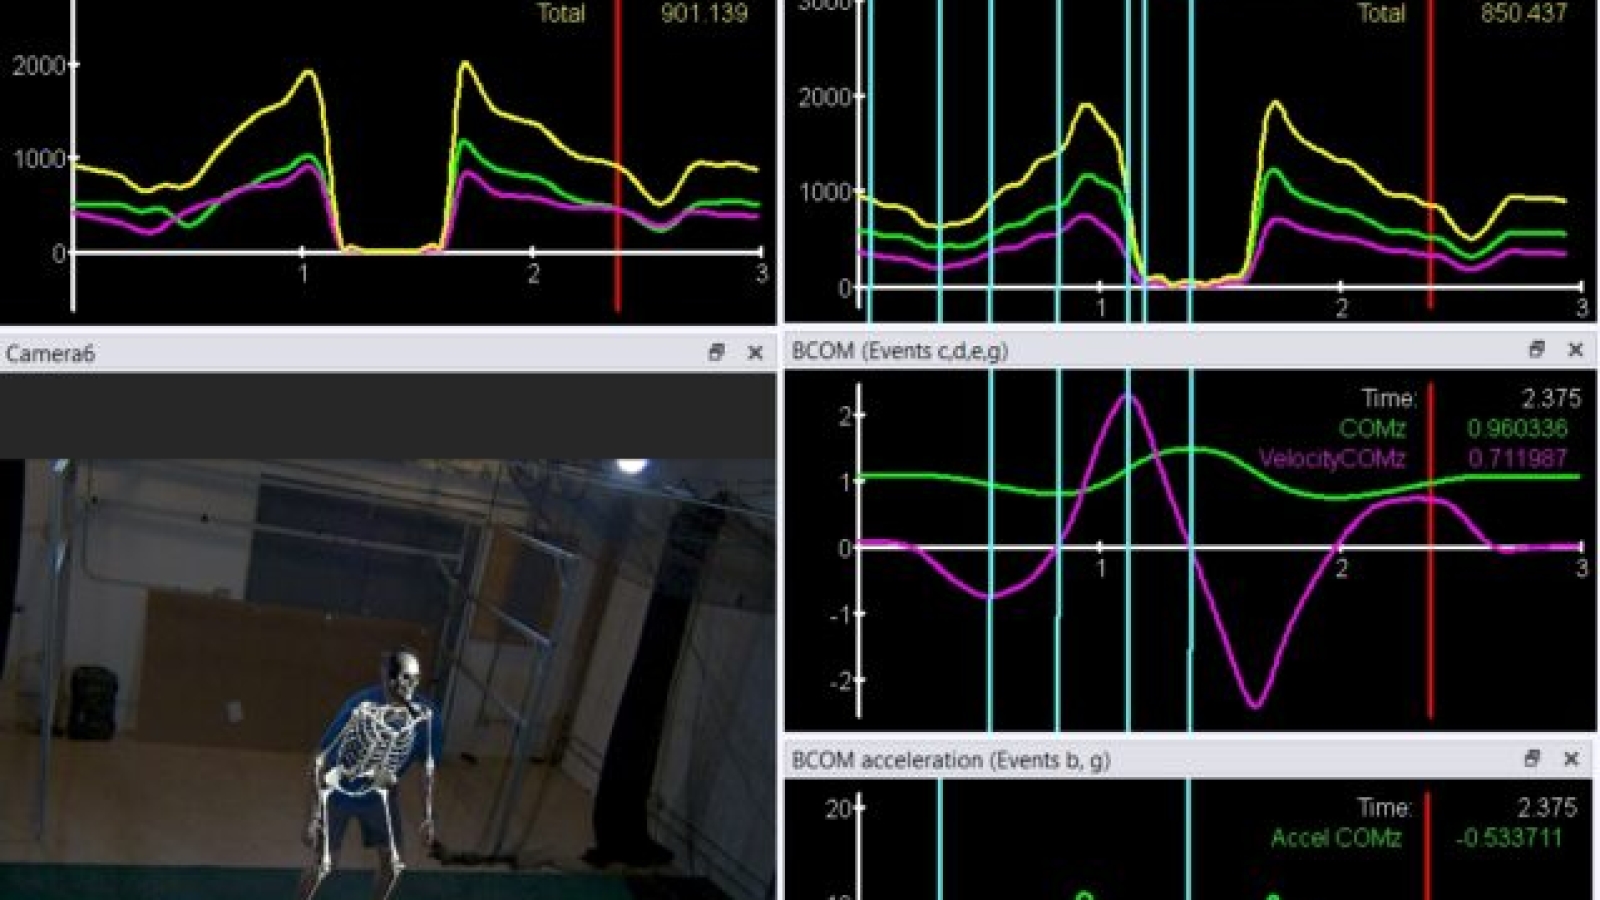
We were particularly interested in how well the jump events from our computed GRF would line up with those events described in Linthorne’s original analysis of CMJs.
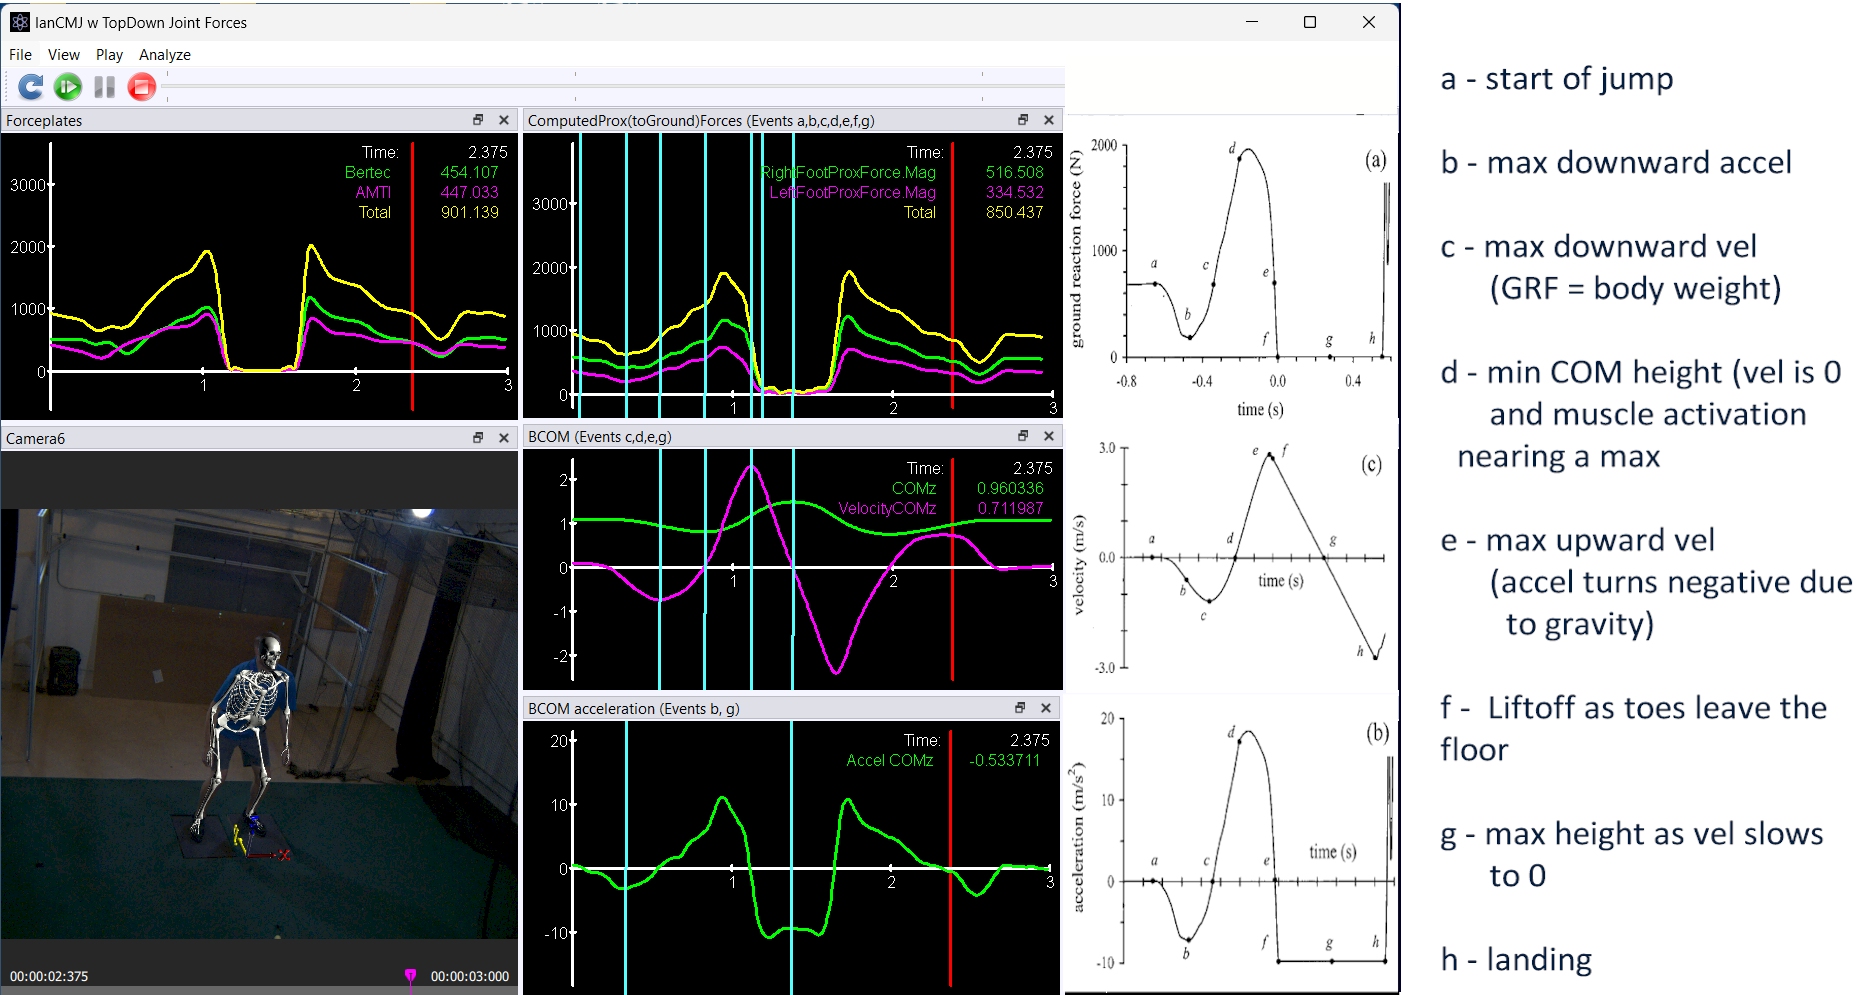
In the image above, diagrams from Linthorne’s original paper are overlaid on a screen shot of The MotionMonitor xGen’s playback of Ian’s CMJ jump. You will need to zoom in for a good look, but the expected jump events are remarkably consistent with Linthorne. All 8 events appear where you would expect them to appear in the ground reaction curves.
The correct identification of jump events means that common CMJ metrics used to fashion strength and conditioning programs can be derived without force plates. Metrics such as eccentric peak forces (EPF), mean eccentric forces (EAF) and rate of force development (RFD) are often used to decide on conditioning programs centered on strength, power or speed. A quick calculation of the averaged data using computed forces vs measured force plate forces revealed:
| Computed | Measured | Percent | |
| EPF | 1,601 N | 1,607 N | 99.6% |
| EAF | 1,208 N | 1,321 N | 96.9% |
| RFD | 8,926 N/sec | 8,870 N/sec | 100.6% |
Conclusion/Discussion
On first look, one must ask why we need to measure forces with a CMJ if we have kinematics and can measure jump height directly. But there are many metrics derived from the force curves that are used by strength and conditioning coaches to assess player development. If one could reliably derive those metrics without the use of force plates, coaches would have more information at lower cost. In addition to metrics on power and speed, coaches would have information on jump mechanics, joint force and moments and the propensity for injury.
While we found the computed ground forces startling for their consistency with force plate data, we are mindful that this assessment was limited to a very few trials from only 2 subjects. There is also a question of the applicability of the approach to other activities. Allocating L5/S1 forces to left and right hips based on measures of COM projected onto the base of support (as we did here) has its problems. Weighted average center of pressure (wCOP) is one measure of weight distribution between left and right feet. David Winter demonstrated early on that wCOP and COM do not track well in dynamic activities with differences determined by the velocity and acceleration of COM. To allocate force to right and left hips based on COM in asymmetrical activities will require algorithms that can account for the effect of the velocity and acceleration of COM.
Despite the problems, we do think that the results should encourage a larger, more scholarly investigation. In the meantime, a description of our setup is described below. If you have any questions or would like a copy of the data files, please feel free to email or call.
Until next time,
Lee & Ian
System Description & Model Definition
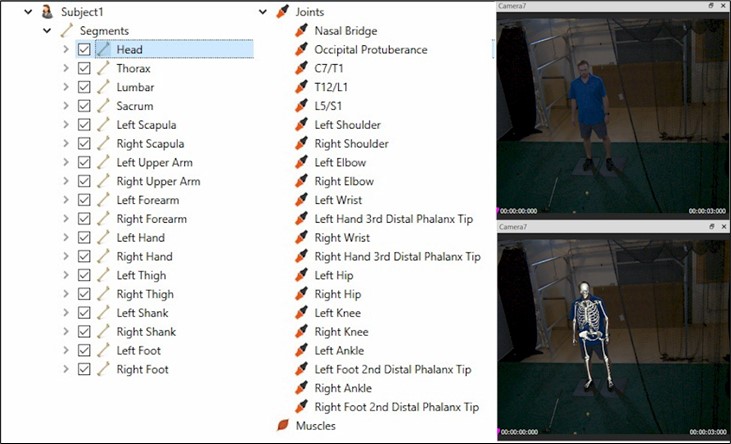
The MotionMonitor xGen4 was configured with an 8 camera Basler Ace2Pro (set to 1.2 MP) collected at 100hz. The system was calibrated to a common global reference frame using extrinsic readings common to all cameras. The right-side force plate was a 40×60 plate by Bertec with a digital amp. The left-side force plate was a 40×60 by AMTI with an analog amp. Force plate data was collected at 1000hz. A standard 18 segment model with 21 joints was created using joint and segment data generated by an AI markerless tracking system.
In most cases, AI systems generate joint data directly. When they do not, joint data is inferred from other reported features. For example, the knee joint center might be located as the centroid of condyles or the toe as offsets from other foot features. Anthropometrics were based on Dempster with segment lengths and total mass scaled to the subject. All data was smoothed using a Butterworth 4th order 6hz digital filter. The top-down force computed at L5/S1 were apportioned to the hip joints based on the relative position of the upper body segments’ center of mass projected onto the base of support.